Standard graphing types are highlighted below showing the most common bean types and relationships that you will see on your output files.
In the first example, two unrelated beans are graphed. One (petStore) is a singleton and is displayed with a double border. The other (myPrototype) is a non-singleton and will be graphed with a single border. The context definition for these two beans may have looked like this
<bean id="petStore" class=".."/>
<bean id="myPrototype class=".." singleton="false"/>

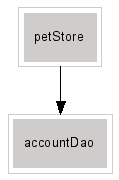
In the next example, a standard dependency between two beans is highlighted. Note that the graphing output will always show a top to bottom layout wherever possible for dependency information. The bean definition producing this output may have looked like this..
<bean id="petStore" class="..">
  <property name="accountDao"><ref local="accountDao"/></property>
</bean>
<bean id="accountDao" class=".."/>

The next graph shows exactly the same two beans, however this time the accountDao bean has been moved into a different context definition file from the one currently being graphed and is shown therefore with a dotted border since we have no other information other than its name. This will commonly be seen on graphs for individual context files, but not on the consolidated graph.

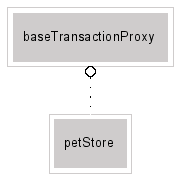
Beans can be defined as child beans by specifying a parent attribute in the XML. This configuration is highlighted with a reverse, open dot arrow head and a dotted line from the child bean to its parent definition. The graph below could have resulted from the following context definition snippet..
<bean id="baseTransactionProxy" class=".."/>
<bean id="petStore" parent="baseTransactionProxy"/>

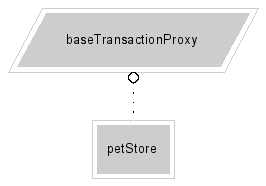
Finally, the same two beans as above, but with the parent bean marked as abstract. The abstract bean is shown with a skewed shape. This could have been generated from the following context definition snippet..
<bean id="baseTransactionProxy" class=".." abstract="true"/>
<bean id="petStore" parent="baseTransactionProxy"/>
